Despite the markets' best efforts, the downtrend in the US indices appears intact. Over the last few days EUR/USD (chart below) has also joined the party and given a short signal. The key drivers or catalyst as to the price direction in an index, currency or a stock are an irrelevance to a true trend trader. Price is all that matters.

Showing posts with label trade the stock market. Show all posts
Showing posts with label trade the stock market. Show all posts
Wednesday, November 07, 2012
Thursday, September 06, 2012
Some nice comments from other trend followers
The bias in the markets over the last few weeks has been to the long side, while still having some short positions open. Despite the choppy uptrend and the low trading volume, this has generated decent profits over the last few weeks.
Today the markets moved up significantly following the news announced by the ECB. This has only helped to increase the profits in our existing positions. How long this uptrend will last is anyone's guess, but while it lasts we will avoid trying to be 'clever' by trying to pick a top in the market and will stay in out positions until we get appropriate exit signals.
Friday, June 29, 2012
All good things will come to an end...
Wnen a trend ends and gives an exit signal, a good trend follower will unemotionally close the position - none of this "I'll give it a bit more room, to see if reverses back to the direction I want". Better still, your stops will already be set, and they will simply take you out of the position automatically. Remember that in a classic trend following system this is the only way that you should exit a position - no human intervention is needed (or wanted).
Thursday, June 28, 2012
Barclays
Some of the downside in the markets today was as a result of the revelations concerning Barclays and their conduct in the LIBOR market. The chart below shows that, even though a long signal was given a few days ago, the preceding price action still shows a series of lower highs and lower lows since the trend starting revesing at the end of March, so this is one long signal that should have been avoided. Even if you did go long on the signal, then adherence to your stops (as clearly defined on the chart) would have meant that you would have been stopped out at some point today with a small loss.
Trend followers NEVER predict
Given the current state of the indices, it is clear to see that, while we are off the lows from earlier this month, no meaningful breakout to the upside has occurred. These periods where there is no meaningful trend, can easily erode a traders' capital due to the whipsawing and 'noise' in the charts. As I write this, markets are down again today, reflecting the volatlity and uncertainty currently present.
Wednesday, June 27, 2012
Proper stop placement
An important thing to remember when placing your stops based on the charts is that these are a solely a guide to the stop placement that you should use. You will see on plenty of charts where price has just touched the exit signals or pierced them very slightly, before price reverts to going in the direction of the trend. This can be frustrating, however what the chart shows may not necessarily mean that you have been stopped out.
Tuesday, June 26, 2012
Trading is not a game of perfect
Psychological aspects from other walks of life can easily be applied to trading. I'm a keen golfer, and one of the most prominent sports psychologists is Dr Bob Rotella, who has worked with many of the world's top golfers over the last 20 years. His first book 'Golf is Not a Game of Perfect' is one of the most prominent books of its type.
Monday, June 25, 2012
Potential vs reality
I can post hundreds, if not thousands of charts showing recent profitable trades based on my own system rules, but at the end of day, the system will only give YOU the profits it can generate if:
a) You can stick to the signals, no questions asked;
b) You have the right state of mind to put up with the inevitable periods of drawdowns;
c) You have clearly defined risk management parameters that you can fully adhere to.
a) You can stick to the signals, no questions asked;
b) You have the right state of mind to put up with the inevitable periods of drawdowns;
c) You have clearly defined risk management parameters that you can fully adhere to.
Henderson Fledgling Trust
A chart of another Investment Trust vehicle showing their smooth trending tendencies, in both directions.


Saturday, June 23, 2012
Trend followers like to be different
Trend following is frequently seen as a stodgy, out-of-date trading methodology compared to new fangled high frequency trading, day trading and other strategies either involving complex formulae, or loads of indicators and squiggly lines drawn over charts.
The true beauty of trend following is in its simplicity. The system rules are relatively straightforward, and can be condensed down to a few simple one liners. Anyone can learn a trend following method, but many refuse to believe that such a simple strategy can make money, and lots of it.
Lots of traders also believe that there is a 'holy grail' out there, and think if they incorporate lots of rules and complex set ups into their own strategy, they will be successful. To a trend follower, trading is extremely simple, but the real key to being able to profit from the method lies in the psychology you must use.
Because of the rules and what we look for when entering and exiting a position, the psychology attached to trend following can also be considered to be 'out of step' with what the majority of traders think. Some of these issues are as follows:
- We discount intraday 'noise' on charts - we prefer to concentrate our energies on the big moves that make the big money;
- Some of our most profitable days are when we do nothing;
- Some of the days where we lose the least are when we do nothing;
- Lots of traders like to go long at bargain (low) prices - we buy on strength;
- Lots of traders exit longs when new highs are reached - that is when we like to get into the same position;
- Lots of traders like to go short at expensive (high) prices - we short on weakness;
- Lots of traders exit shorts when new lows are reached - that is when we like to get into the same position;
- Lots of traders focus their energies on a high win percentage - trend following historically gives a win rate of about 40%;
- When going long, lots of traders determine an exit price - our only target price is infinity;
- When going short, lots of traders determine an exit price - our only target price is zero.
- Lots of traders focus solely on the winning - trend followers focus on the losing (i.e. we cut losses short, and let our profits run, the majority do the opposite);
- Traders want to be proven right on their opinions about the market - trend followers have no opinions on the market, and are simply concerned with making money.
Friday, June 22, 2012
Repost - See what your existing positions are telling you
Below is a repost of what I wrote on 01 December 2010, which is just as valid today - the only difference is that currently shorts are continuing to be profitable while the market gave a long signal last week, whereas when I wrote the original post I was holding long positions when a short signal was given in the general market. Again, a real life example of why you should never cut short profitable trades until you get an exit signal. Let the trend play out:
"I have been asked as to why I haven't gone in all short following the volatility in the general indices, and a 20 day low being made on the FTSE last week.
You have to pay attention to what your existing holdings are telling you. In my case, the long positions in my portfolio have held up pretty well, and ironically the one stock I was stopped out of last week was a short position!
As a trend follower, I never want to manually close an existing position, and override my stop methodology. I created the rule for stop placement for a reason - to keep me in the trend, and to prevent me from making a hasty decision to exit my positions. I therefore kept my long positions open, and will continue to do so as long as the stops are not hit.
In addition, I also had to respect my overall portfolio risk parameters, which prevented me from opening new positions (either short or long)."
Thursday, June 21, 2012
Aquarius Platinum
It was only just over a year ago that this UK stock was over 400p - trend followers would have taken several chunks out of this on the short side (despite some failed signals), culminating in this current downtrend. I have no knowledge of the fundametals here, but knife catchers and bottom pickers would have been repeatedly burned on this one. This is now comfortably below the 2008 low. Next stop zero?


Change of webinar date
Having been advised by more than one person that both my webinar dates this week clashed with some Englishmen kicking a football around on a bit of grass, the webinar scheduled for Sunday evening has been cancelled - it is now rescheduled for Tuesday 26 June at 2000hrs, when I am assured there is no football on! To reverse your place and to find out more details, click here.
A state of flux
Despite the general indices giving a long signal earlier this week, we are cuurently experiencing fluctuations as a result of further developments with the Eurozone, as well as the latest Federal Reserve announcements. Again, this is one reason why I rarely trade indices and currencies, which are prone to whipsawing in environments like this and, in my own experience, do not trend as well as individual equities.
As I have mentioned before, I use the indices solely as a guide as to which direction I should be looking for the majority of any new positions, BUT I always try and have one or two trades in the opposite direction.
One trader in my mentoring programme, who I know has profited nicely during the recent downtrend, still has some short positions open - the charts show that current price is still below the stops as indicated by the system, and therefore he has done nothing on those trades apart from adjust his trailing stop as required. He has therefore not 'cut short' his profits - he is letting them run, which is entirely the correct thing to do. It is also why, even when there is a new trend signalled in the general markets, there is no need to charge into lots of new positions - you can play yourself in, limiting yourself if need to be to one or two new positions per day, in case the new market trend fails.
Tuesday, June 19, 2012
Good things come to those who use good risk control
Anyone who thinks that trend following doesn't work obviously hasn't studied the many charts I've posted on here recently. Trends may only last a matter of weeks, but over time the results add up. Don't take my word for it - there have been too many traders who have used trend following principles to make significant money in the markets.
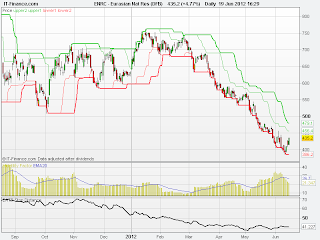
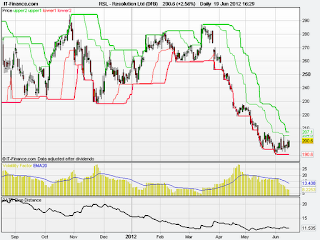
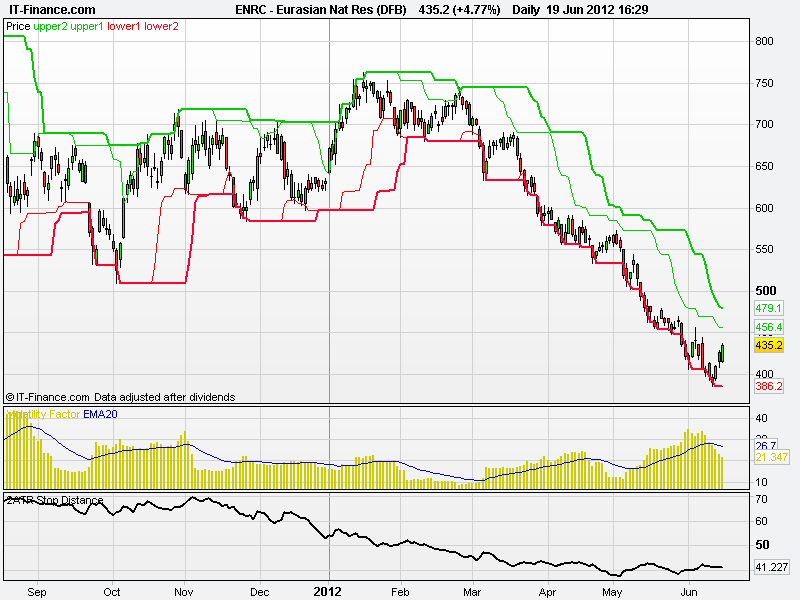
The only problem is that we never know which signal will generate the big wins. Look at the two charts below, that show beautiful recent downtrends, having repeatedly had failed breakouts prior to that.
A trend follower must be completely at ease in being able to follow the signals unemotionally, in whatever direction the charts are telling you. You must also have the ability to switch from looking for longs to short, or vice versa, in a relatively short period of time - again, being led by what the charts are showing. Strict risk management will help with this, as you must never 'bet the farm' on any individual trade - to coin a famous term from Market Wizard Larry Hite, you must have an 'emotional indifference' to each position you take, which is impossible if you are trading too large a position relative to your trading equity. Had you have done so on the failed breakouts shown on the charts below, you would have suffered a serious erosion in your capital, or have even blown up your account, meaning that you wouldn't have been around to take advantage of the nice downtrends that finally developed over the last few weeks.

Monday, June 18, 2012
Some pointers for you
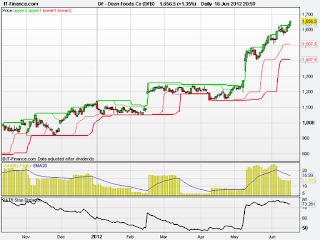
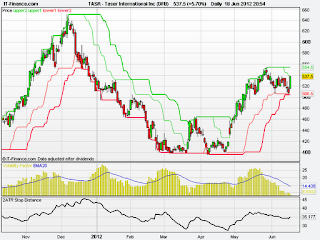
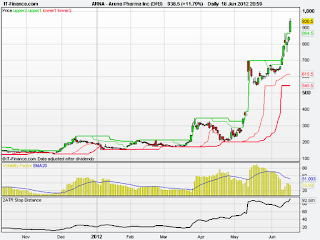
I've shown charts of three US stocks that to highlight some points of interest which are covered in my e-book.
Dean Foods was the subject of a recent post here and it's still trending up nicely. Remember this broke out to the upside after failing to break down while the general market was going down, and therefore was showing good relative strength. Now that the trend is developing nicely, there's no need to run for the exits here - just trail that stop up as per the charts (and remembering to take into account the spread when placing your stops), and keep holding until the trend ends.
Stun gun company Taser sports a curious chart in that the trends apparent here seem to have been the inverse of the general market! After an uptrend towards the end of last year, the stock went into a profitable downtrend from mid-December through to mid-March, while the markets were trending up nicely. Then it formed a new base and broke out to the upside near the end of April, carried on up through out May and is currently consolidating. As I've said before, I try to have one or two stocks that are going in the opposite direction to the general market, as they can highlight unusual relative strength or weakness in a particular stock. This is a prime example of that.
The final charts is that of Arena Pharma. As you can see, this gave a false start during April when the previous long signal only produced a small profit before being stopped out. However, a new long signal was generated just before the big gap up towards the middle of May, then consolidated, before moving on up again. This is a good example of a good looking set up that failed (which can easily happen), but then gives you a great trend on the next signal. Failed signals like the first one are frustrating, but they are part of the game for trend followers. As an example, imagine you traded a basket of commodities, and gold gave you six failed trades in a row. Would you take the seventh signal, which happened to be the one that generated a huge trend, and covered the losses of the previous six trades and still gave you an overall profit? Just because a stock (or any instrument for that matter) generated a loss on a previous trade, if the setup still looks good, you should consider trading it. Arena Pharma is a great example of that.
Dean Foods was the subject of a recent post here and it's still trending up nicely. Remember this broke out to the upside after failing to break down while the general market was going down, and therefore was showing good relative strength. Now that the trend is developing nicely, there's no need to run for the exits here - just trail that stop up as per the charts (and remembering to take into account the spread when placing your stops), and keep holding until the trend ends.

Stun gun company Taser sports a curious chart in that the trends apparent here seem to have been the inverse of the general market! After an uptrend towards the end of last year, the stock went into a profitable downtrend from mid-December through to mid-March, while the markets were trending up nicely. Then it formed a new base and broke out to the upside near the end of April, carried on up through out May and is currently consolidating. As I've said before, I try to have one or two stocks that are going in the opposite direction to the general market, as they can highlight unusual relative strength or weakness in a particular stock. This is a prime example of that.

The final charts is that of Arena Pharma. As you can see, this gave a false start during April when the previous long signal only produced a small profit before being stopped out. However, a new long signal was generated just before the big gap up towards the middle of May, then consolidated, before moving on up again. This is a good example of a good looking set up that failed (which can easily happen), but then gives you a great trend on the next signal. Failed signals like the first one are frustrating, but they are part of the game for trend followers. As an example, imagine you traded a basket of commodities, and gold gave you six failed trades in a row. Would you take the seventh signal, which happened to be the one that generated a huge trend, and covered the losses of the previous six trades and still gave you an overall profit? Just because a stock (or any instrument for that matter) generated a loss on a previous trade, if the setup still looks good, you should consider trading it. Arena Pharma is a great example of that.

Sunday, June 17, 2012
A few home truths
Just to clarify a few things about trend following:
- Trend following historically has a relatively low win percentage, across all asset classes. The positive expectancy from using such a system comes from the size of the winners far exceeding any losses incurred;
- Trend followers never try to predict tops or bottoms in markets - they buy on strength and sell on weakness;
- Strict risk managment and position size minimises the losses as far as possible when a losing streak hits;
- Probably 80% of your trades each year will cancel each other out - consisting of small winners, small losers (restricted to 1R of your capital) and break-even trades;
- The remaining 20% of your trades will probably account for 100% of your profits, but you never know which ones will generate the profits when you open the position;
- To achieve this you HAVE to let the profits run until you receive an exit signal;
- Stops are updated as often as your system rules determine;
- And you have to adhere to your stops at all times;
- Nobody knows when a trend will reverse, however when it does, you automatically give back a portion of your profits before your (trailing) stops are hit;
- If a trend breakout reverses or fails just after entering a position, you will incur losses;
- Significant increases in volatility can cause losses due to whipsawing or trading 'noise';
- The best market conditions for trend followers are trending, stable markets;
- The worst market conditions for trend followers are non-trending, volatile markets;
- There are numerous trend following methods out there, but although the entry/exit parameters may vary, trend followers as a rule will make (or lose) money in the same markets at the same times;
- Remember that you need a trend to make money! Simple, but obvious. Periods such as 2011 in general or February/March 2012, where there are no trends, are difficult for trend followers and drawdowns occur in these periods;
- On the flip side, the downtrends in 2008 and the uptrends in 2009-10 generated huge profits for trend followers, but if you can't accept the above points, then it is highly unlikely you would have profited as much as you should have from these 'trendier' periods in the market.
Why trend followers get the biggest gains in BOTH directions
Think back over the last 20 years or so, and of the stocks that increased the most in that time before falling back or levelling out. Who's on the list? Well, there are hundreds of multi-baggers, but to take just three (that everyone has heard of), there's Microsoft, Google and Apple.
Now think of those people who trade in the markets, who like to get a bargain. Generally, this means they like to buy something that's fallen in price, so that they feel like they are getting value for money. As a rule, they like to buy low, and sell high.
To get the huge winners like those three that I mentioned above, would someone who likes to buy on a dip have been able to get in on those stocks? Somehow I doubt it. The one thing those stocks did was continually make new high, after new high, after new high. They were trending to the upside.
Even if someone DID get in on one of those stocks on a pullback, I very much doubt they rode the trend for all it was worth - they probably got out when they got an 'overbought' oscillator reading, or a minor down day within the context of the uptrend. Worse still, they may have even have tried going short on the basis that 'it can't go up any further'.
The people who would have ridden those stocks up were either investors, or trend followers, who would have been getting repeated signals on the way, and may even have pyramided their positions (while still respecting their risk parameters) all the while the uptrend was intact.
What investors DON'T necessarily have is an exit plan, that enables them to ride such stocks on the way up, but enables them to get out with the bulk of their profits intact when the top is reached.
Now you may say that those three companies mentioned above had faultless fundamentals, but there are thousands of other stocks that had huge share price rises on nothing more than hype (think 1999 and dot.coms).
Sure, to have ridden these stocks all the way you would have needed a longer-term trend following system, but even a shorter-term system like I trade would have enabled you to get large chunks of those rises, would have got you out at an appropriate time when price told you to do so, AND would have even have told you when to short these burnt out shooting starts, like the dot.coms and thousands of others that have come and gone into the midsts of time. Again, if a stock is trending downwards, making new low, after new low, after new low, it is the trend followers who are able to stay the course all the way until the trend ends, or the stock reaches zero.
Want a case study? Go find a chart of Enron - trend followers would have made a fortune in both directions, while those who wanted to buy on pullbacks probably missed out on the way up, and when the trend reversed kept getting stopped out when they were entering long positions, thinking they had got a bargain. More recent examples include Research in Motion and First Solar to name just two.
I was speaking to someone last week who has always looked upon himself as an investor, and was looking for a way to marry up his fundamental beliefs with that of price action, that did not require lots of PC time. In this regard, a trend following system is an ideal candidate. The parameters of such a system can easily be tweaked to coincide with your preferred timeframe/holding period, but will still tell you when to get out of either a winning or losing position.
Don't believe me? Well, look at someone like David Harding at Winton Capital - his hedge fund has been long on gold for over 10 YEARS - he bought when it was still in the $200's. But he will know when the party is over and will exit the position at the appropriate time (and he may have done already - I do not know).
A brilliant quote
"If you really know what's going on, you don't even have to know what's going on to know what's going on...You can ignore the headlines, because you anticipated them months ago".
Think about that, from the viewpoint of a trend follower, and/or someone who believes price precedes news. Then think back to the dot-com bubble, the 2008 market crash, or the recovery in 2009-10.
Incidentally, the quote above I got from Sebastian Mallaby's book More Money Than God, which plots the story of hedge funds since A.W. Jones's first 'hedge-d' fund in the 1960's, the birth of the concept and the original rationale of how such a fund would operate. Those of you who have read Market Wizards will immediately recognise some of the names in the book (along with other famous traders and hedge funds), including how the famed Commodities Corporation morphed from trading on ecomonic data to a trend following methodology. I came across the book yesterday in the local store, and have not been able to put it down since. An excellent read.
Friday, June 15, 2012
NEW - online 1-2-1 consultations!
In addition to the group webinars I am now running I am also available for 1-2-1 consultations via your PC, at a time to suit. These will be in the form of a 1-2-1 webinar, with voice communication (not available in the group webinar) and access to the screen/charts/scans etc.
These sessions can be tailored to each individual's requirements, whether you are simply interested in learning more about trend following, or already have the knowledge/experience of such a system.
For more details click here.
These sessions can be tailored to each individual's requirements, whether you are simply interested in learning more about trend following, or already have the knowledge/experience of such a system.
For more details click here.
Subscribe to:
Posts (Atom)